


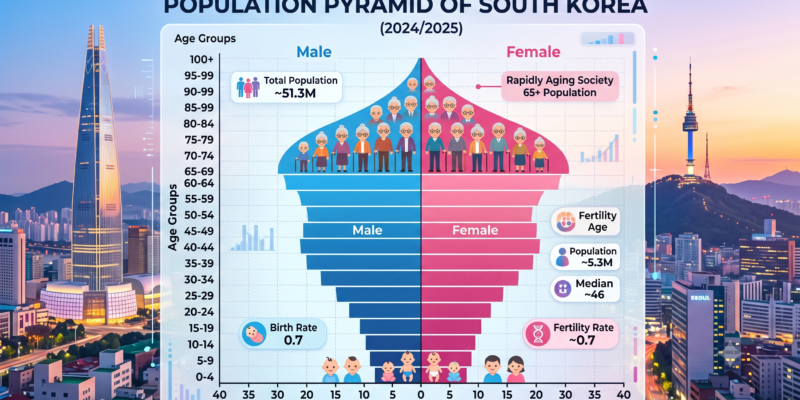
The population pyramid of South Korea no longer looks like a pyramid. It looks like a vase that is widest in the middle and thin at both the bottom and the very top, with a growing bulge of older adults. In 2026, South Korea’s population stands at roughly 51.6 million people, the working-age group makes up about 69 percent of everyone, and adults aged 65 and above outnumber children under 15 by more than two to one.
This guide explains exactly how to read the South Korea age structure, how the shape changed from the 1960s to today, why the South Korea fertility rate fell to the lowest level ever recorded anywhere, and what the South Korea population decline means for travelers, job seekers, and Indian students planning to study in Korea.
Quick answer: The population pyramid of South Korea is classified as constrictive (also called a contracting pyramid). Roughly 9.8 percent of people are aged 0 to 14, about 68.7 percent are aged 15 to 64, and about 21.4 percent are aged 65 or older. The median age is around 46 years, and the total fertility rate was 0.80 in 2025.
Population Pyramid of South Korea at a Glance: 2026 Snapshot
Before looking at history, here is the current South Korea demographics picture. The figures below come from the UN World Population Prospects 2024 projection for 1 July 2026, as summarized by PopulationPyramid.net and populationpyramids.org, plus Korea’s own Ministry of Data and Statistics for births.
| Indicator | 2026 value |
|---|---|
| Total population | about 51.6 million |
| Population rank in the world | 31st |
| Young population (ages 0 to 14) | about 5.07 million (9.8%) |
| Working-age population (ages 15 to 64) | about 35.47 million (68.7%) |
| Elderly population (ages 65+) | about 11.06 million (21.4%) |
| Median age | about 46.2 years |
| Annual population growth rate | about -0.13% |
| Dependency ratio | about 45.5% |
| Sex ratio (males per female) | about 0.99 overall, 1.06 in the working-age group |
| Total fertility rate (2025, national statistics) | 0.80 |
Two numbers in that table explain almost everything else in this article. First, the elderly group is already more than double the child group. Second, the South Korea birth rate and fertility rate sit far below the 2.1 children per woman needed to keep a population stable without immigration.
If you want the geography and land-size side of the story, our guide on how big South Korea is shows how a small, mountainous country carries more than 51 million people.
What Is a Population Pyramid and How Do You Read South Korea’s Age Structure?
A population pyramid is a double-sided bar chart. Males are shown on one side and females on the other, and each horizontal bar represents an age group, with the youngest at the bottom and the oldest at the top. The width of each bar shows how many people are in that age band.
Demographers sort pyramids into three broad shapes, and the population pyramid of South Korea has moved through all three within about 60 years.
| Pyramid type | Shape | What it signals | South Korea |
|---|---|---|---|
| Expansive | Wide base, narrow top | High birth rates, young society | 1950s to 1970s |
| Stationary | Roughly rectangular | Stable births and deaths | Brief transition period |
| Constrictive | Narrow base, wider middle and top | Low birth rates, aging society | 1990s to today |
To read the South Korean pyramid correctly, look at three zones:
- The base (ages 0 to 14). This is the future workforce. In Korea it is very narrow because of the long fall in the South Korea fertility rate.
- The middle (ages 15 to 64). This is the working-age population. It is still the largest zone, but it has started to shrink in absolute terms.
- The top (ages 65+). This is the elderly zone, and it keeps widening as the large baby-boom cohorts retire.
How the Population Pyramid of South Korea Changed from 1960 to 2026
The baby boom era: a classic wide-base pyramid (1950s to 1970)
After the Korean War, South Korea had a textbook expansive pyramid. In the first official census in 1949, the country counted about 20.2 million people. Researchers who compared the pyramids of North and South Korea note that a baby boom began at the end of the Korean War and lasted until about 1970. By 1970, nearly 29 percent of the population was under 10 years old.
At that stage, older people were rare. The share of people aged 65 and above rose only slowly between 1960 and 1990, from about 3.7 percent to about 5.0 percent.
The fertility collapse: a narrowing base (1975 to 2000)
Government family-planning campaigns, rapid urbanization, rising female education, and an industrializing economy pulled birth rates down quickly. Demographic studies show that both Koreas developed a narrow base after 1975. By the late 1980s, the South Korean population had reached roughly 42 million, and growth was already slowing.
This was also the period when the country’s economic growth reshaped its politics, and the same wealth that raised living standards also lowered family size.
The aging era: a vase-shaped pyramid (2000 to 2026)
South Korea’s population passed 50 million in 2012 and reached its peak at roughly 51.8 million around 2020. Since then, deaths have exceeded births every year, and the total population has begun to shrink. Statistics from the national statistics agency project a fall to about 36.2 million by 2072.
The population pyramid of South Korea in 2026 therefore shows a strong middle (people born in the late 1960s to the 1970s and the 1990s echo generation), a thinning base, and a rising top.
South Korea Fertility Rate and Birth Rate: Why the Base Is So Narrow
The South Korea fertility rate is the single biggest reason the base of the pyramid is so thin. The total fertility rate (TFR) is the average number of children a woman is expected to have in her lifetime.
| Year | Total fertility rate |
|---|---|
| 2015 | 1.24 |
| 2017 | 1.05 |
| 2018 | 0.98 |
| 2020 | 0.84 |
| 2021 | 0.81 |
| 2022 | 0.78 |
| 2023 | 0.72 (lowest on record) |
| 2024 | 0.75 |
| 2025 | 0.80 |
Since 2018, South Korea has been the only OECD member with a fertility rate below 1.0. The replacement level is 2.1, so the country has been running at roughly one third of what is needed to hold the population steady.
The 2025 rebound: a small turn, not a reversal
The latest data brings a more hopeful note. According to Korea’s Ministry of Data and Statistics, births rose about 6.7 percent in 2025 to roughly 254,300, the highest since 2021, and the fertility rate climbed to 0.80. Marriages, which are a leading indicator of births, had jumped nearly 15 percent in 2024, the biggest rise since records began in 1970.
Still, deaths were about 363,400 in 2025, which means the natural decrease was around 108,900 people and the sixth straight year of natural population decline. A rebound in births slightly lifts the bottom of the pyramid, but it does not fix the shape.
Age and region: where births are changing
The 2025 data also shows a shift in who is having children:
- Women aged 35 to 39 reached a record 52.1 births per 1,000 women.
- Women aged 30 to 34 recorded 73.1 births per 1,000.
- Women aged 25 to 29 fell to 21.2 births per 1,000, down from 30.6 in 2020.
Regional gaps are wide. South Jeolla Province had the highest fertility rate at 1.09, followed by Sejong at 1.06, while Seoul had the lowest at 0.63. If you are curious about how the country is divided, see our explainer on the list of states and provinces in South Korea.
Aging Population in South Korea: The Top of the Pyramid
The upper section of the South Korea age structure tells the other half of the story. With about 21.4 percent of residents aged 65 or older, the country is considered a super-aged society under the common United Nations style threshold of 20 percent.
Key aging indicators in 2026:
- Median age: about 46 years, among the highest in the world.
- Elderly versus children: adults aged 65 and above are more than twice as numerous as children under 15.
- Dependency ratio: about 45.5 percent, meaning roughly 45 dependents for every 100 working-age people.
- Demographic stage: the UN-based profile places South Korea in the late stage of the demographic transition, with a constrictive pyramid.
Living longer is a success story, and the country’s high life expectancy is one reason the top keeps widening. You can see how health, schooling, and income fit together in our breakdown of the Human Development Index of South Korea.
South Korea Population Projection: What the Pyramid Will Look Like Next
Projection models point to an even more inverted shape. Using the same UN-based dataset, the working-age share is expected to fall below 60 percent around 2039. The national statistics agency projects a total population of about 36.2 million by 2072.
| Year | Population milestone |
|---|---|
| 1949 | About 20.2 million (first census) |
| 2012 | Passed 50 million |
| 2020 | Peak of about 51.8 million |
| 2026 | About 51.6 million |
| 2039 | Working-age share expected to drop below 60% |
| 2072 | About 36.2 million (national projection) |
Projections depend on future fertility, marriage, and immigration trends, so the 2025 rebound could soften the decline if it continues. Treat any long-range figure as a scenario, not a certainty.
Population Pyramid of South Korea vs North Korea and India
Comparing neighbors helps put the South Korea population structure in context.
- North Korea: Research comparing both Koreas shows similar broad shapes, including a baby boom after the war and a narrowing base after 1975, but the North’s most recent full census was in 2008, so its data is far less current. Read more in our guide to the differences between North and South Korea.
- India: India still has a much younger structure, with a median age under 30 and a broad working-age base. That contrast is one reason Korean universities and employers are increasingly interested in Indian talent.
Why Is the Population Pyramid of South Korea Changing So Fast?
No single cause explains the South Korea population decline. Researchers and news reports point to a combination of forces:
- Housing costs. Rapidly rising house prices, especially in Seoul, make marriage and children harder to afford.
- Higher female education and employment. More women are in the workforce, but workplace and childcare systems have not always kept pace.
- Delayed marriage. The age at first marriage and first birth keeps rising, which is why births to women in their late 30s are growing while births to women in their late 20s are falling.
- Education and living costs. Competitive schooling and high household expenses weigh on family decisions. Our cost of living in South Korea guide shows what daily life actually costs.
- Longer life expectancy. People living longer pushes the top of the pyramid wider even without any change in births.
Economic and Social Impact of South Korea’s Aging Pyramid
A narrow base and a wide top affect almost every part of national life.
- Labor market: A shrinking working-age population means labor shortages, higher demand for skilled foreign workers, and pressure to raise productivity.
- Pensions and healthcare: Fewer workers support more retirees, so public spending on pensions, elder care, and hospitals rises.
- Schools and universities: Fewer children means falling enrollment, school closures in rural areas, and strong incentives for universities to recruit international students.
- Regional gaps: Smaller towns and provinces age faster than Seoul and other large cities.
- Economy and wages: Even with a smaller population, the country remains wealthy. See whether South Korea is a rich country and how it ranks as a developed or developing country.
What the South Korea Population Pyramid Means for Indian Students and Workers
For readers of this site, demographics are not abstract. A shrinking domestic population creates real openings.
For students. Korean universities face fewer local applicants and are expanding English-taught programs and scholarships for international students. If you are planning to apply, start with our guide on how to study in South Korea, compare the universities in South Korea for international students, and review the South Korea student visa requirements.
For job seekers. Labor shortages raise demand for foreign professionals in several sectors. Explore jobs in Korea for Indians, the best jobs in South Korea for foreign workers, and the average salary in South Korea per month.
For long-term residents. Policy discussions about immigration and residency continue. If you are thinking beyond a degree, read about citizenship of South Korea and the Hindu population and Indian community in South Korea.
For a day-to-day picture of what it feels like to live in an aging, fast-moving society, read life in South Korea for Indians and students.
How Is South Korea Responding to Population Decline?
The government has spent heavily on incentives over the past two decades, including childcare support, housing programs, parental leave expansion, and cash benefits for newborns. Independent analysts note that the 2025 uptick followed large spending, but that fertility still remains the lowest in the developed world. Policy discussions now also cover work-hour reform, immigration, automation, and extending the working life of older adults.
Because laws and benefits change frequently, check official Korean government sources for the latest figures and programs before making decisions based on them. Policy debates are handled in the National Assembly, which you can learn about in our guide to the National Assembly of South Korea.
Key Takeaways: Population Pyramid of South Korea in 2026
- The population pyramid of South Korea is constrictive: narrow base, wide middle, widening top.
- Population is about 51.6 million, down from a peak of roughly 51.8 million around 2020.
- About 9.8 percent are under 15, 68.7 percent are 15 to 64, and 21.4 percent are 65 or older.
- The South Korea fertility rate hit a record low of 0.72 in 2023 and recovered to 0.80 in 2025.
- Deaths have exceeded births since 2020, and national projections point to about 36.2 million people by 2072.
- An aging population creates labor and pension pressure, and also creates opportunities for international students and skilled workers.
Frequently Asked Questions About the Population Pyramid of South Korea
What does the population pyramid of South Korea look like in 2026?
It is a constrictive pyramid, shaped more like a vase. The base (ages 0 to 14) is narrow at about 9.8 percent of the population, the middle (ages 15 to 64) is the widest at about 68.7 percent, and the top (ages 65 and above) is growing at about 21.4 percent.
What type of population pyramid does South Korea have?
South Korea has a constrictive, or contracting, pyramid. Younger age groups are smaller than the groups above them because of very low fertility, while longer life expectancy keeps the upper age groups large.
What is the current population of South Korea?
South Korea’s population in 2026 is about 51.6 million according to the UN World Population Prospects 2024 projection. It peaked at roughly 51.8 million around 2020 and is now slowly declining.
What is the fertility rate in South Korea?
The total fertility rate was 0.80 in 2025, up from 0.75 in 2024 and a record low of 0.72 in 2023. The replacement level is 2.1, so the rate is still far below what is needed for a stable population.
What is the median age in South Korea?
The median age is about 46 years in 2026, which places South Korea among the oldest populations in the world.
Is South Korea a super-aged society?
Yes. A society is typically called super-aged when 20 percent or more of people are 65 or older. South Korea’s elderly share is about 21.4 percent in 2026 according to the UN-based profile.
Will South Korea’s population keep falling?
National projections point to a decline to about 36.2 million by 2072. The 2024 and 2025 rise in births is encouraging, but demographers say it would need to continue for many years to change the long-term direction.
How does South Korea’s population decline affect international students?
Falling domestic enrollment gives Korean universities strong reasons to attract international students, and labor shortages increase demand for skilled foreign workers. Start planning with our study in South Korea after 12th guide.
Plan Your Move to Korea
Understanding the population pyramid of South Korea helps you see why the country is opening more doors to international talent. If you want personalized help with courses, admissions, or visas, explore Korean courses, read about student life, discover Korean culture, or contact our team.
Sources and Data Notes
- UN World Population Prospects 2024 (2026 projection), via PopulationPyramid.net and populationpyramids.org
- Ministry of Data and Statistics (Korea), 2025 birth and death statistics, via Korea.net, Korea Times, Xinhua, UPI
- Wikipedia, Demographics of South Korea
- Visual Capitalist, South Korea’s rise to the world’s oldest society
- Academic comparison of North and South Korean population pyramids (arXiv 1803.07776)
- Statista and national statistics for historical fertility rates
Figures marked as 2026 are projections and may differ slightly from Korea’s resident registration data. Verify against KOSIS (kosis.kr) before using in official documents.